Live demo

Give CEEZ something you need done.

Pick an objective. The agentic workforce assembles the right specialists, reasons over trusted context and acts within authority — sealed to the trail as it goes.

Then get an account of your own: give us your email and we send back a username and password that open both the AI workforce and the SD-WAN app it runs, on a real three-week telemetry sample.

The simulation

Pick an objective. Build the workforce.

CEEZ compiles semantic context before any agent acts.

Business intent

Reconcile and close, overnight

“Reconcile yesterday’s transactions, flag mismatches over $5k, and stage a dual-control approval.”

Agentic AI workforceidle

ObjectiveClose yesterday · 1.8M transactions

  • Ledger Reconcilermatches
  • Exception Analystexplains
  • Policy Checkergates
  • Approval Routerescalates
Result—

Objective → compiled context → governed execution → sealed outcome

Your access

Run it on real data instead.

The simulation above is scripted. The live demo is not — it is a working workforce running a real SD-WAN operations center, and one login opens both apps. Enter your email and we will send you a username and password to sign in with.

We email your username and password to that address, and nothing else. No spam.

Take the full guided tour

Differentiators

What makes CEEZ different.

The parts you won’t find in a dashboard or a chatbot — look for the ★ marker below.

Incident → agent, in one click

From any NetPulse incident, Investigate dispatches a team and Deep ↗ opens a multi-round, verified root-cause case. The observability app and the AI workforce are the same system.

Goal-seeking agents

Goal daemons pursue an objective on their own — no prompt — bounded by a hard autonomy governor (budget caps + a kill-switch).

Correlation & ML gray-failures

Dozens of alerts collapse into a few root situations, and the ML detector surfaces ~180 gray failures a day that never cross a static threshold.

Earned autonomy

Actions start supervised and graduate to L2/L3 on proven accuracy — auto-reverting on regression. The agent owns the brain, never the hands.

Sealed, blind, auditable

Every consequential action is cryptographically sealed with its evidence; RCA runs answer-key-blind so it can't cheat.

Freeze it into a runbook

A good agent run becomes a deterministic, $0, replayable pipeline — on demand, on a schedule, or via API.

Part 1 · The platform

The CEEZ workforce.

A governed team of AI agents that does the work, at ceez.ai. Sign in (tenant sdwan); the sidebar is grouped Build · Run · Oversee · Analyze · Configure.

1.1

Command Center

Home

Your manager's desk — what needs a decision, the live pulse, and one-click actions.
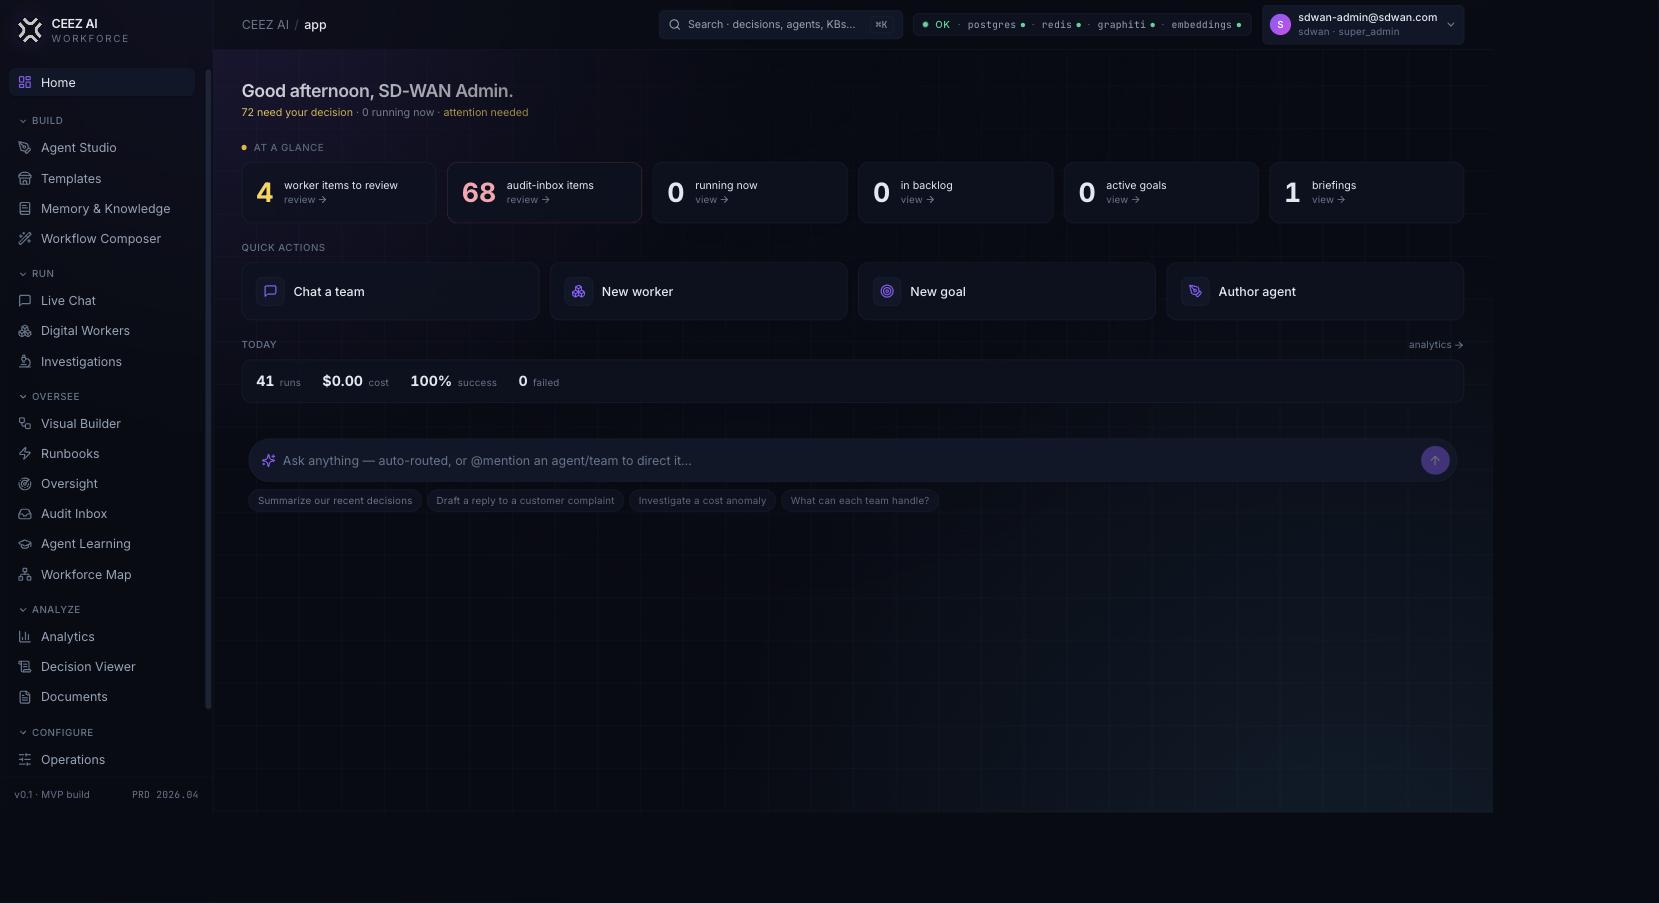
  1. 1After login you land here. Read how many items need your decision and how many are running now.
  2. 2Scan At a Glance: worker items to review, audit-inbox items, active goals, briefings.
  3. 3Note Today (runs, cost, success) and try the "Ask anything" bar.
Why it matters: a workforce needs a manager's desk — humans stay in control without micromanaging every agent.
The Command Center — "72 need your decision", at-a-glance tiles, quick actions, and an ask bar.
1.2

Live Chat

Run › Live Chat

Chat with any agent or team; sessions persist and cross-team routing is automatic.
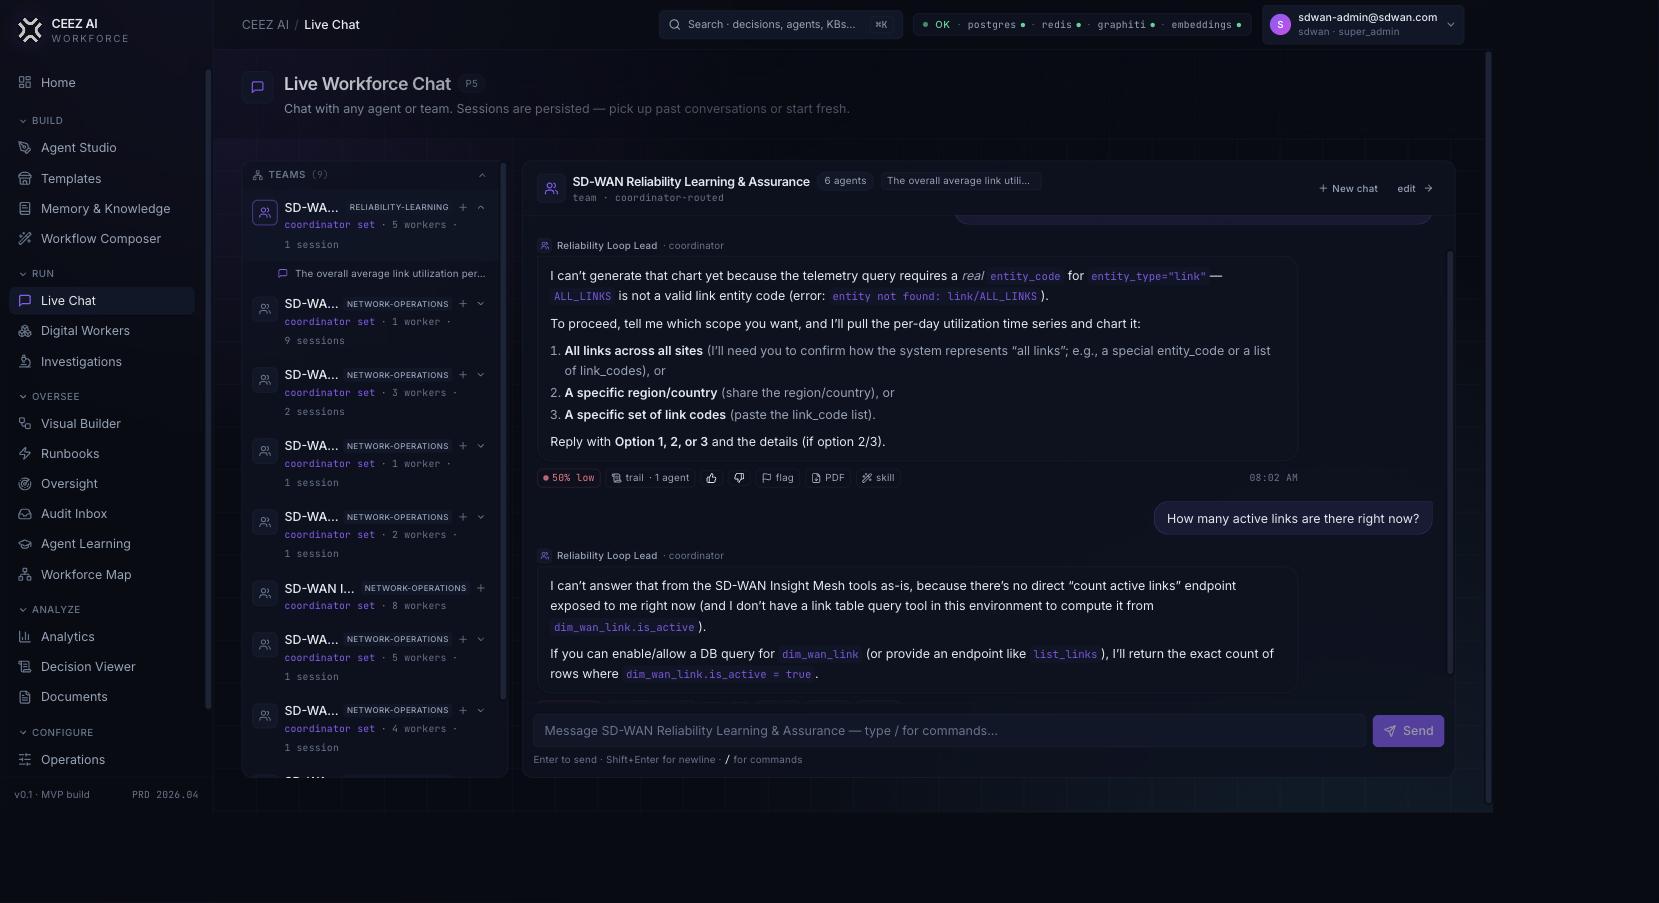
  1. 1Pick a team on the left and ask a question — it routes to the right agent and answers from live data.
  2. 2Note the reply controls: a confidence chip, the evidence trail, and one-click PDF / save-as-skill.
Why it matters: answers are grounded and honest — if the data can't support a claim, the agent says so rather than guessing.
Live Workforce Chat — 9 SD-WAN teams; a coordinator-routed conversation grounded in live data.
1.3

Investigations — multi-round deep RCA

Run › Investigations

Goal-driven cases: an agent or team investigates across rounds, accumulating evidence until a verified conclusion.

  1. 1Header stats: 48 cases · 88% close rate · 75% avg confidence.
  2. 2Open a case: read the Objective, then the Summary with the exact rows queried as evidence.
  3. 3Note the round marker (e.g. R6/6) — this took multiple verified rounds, not one shot.
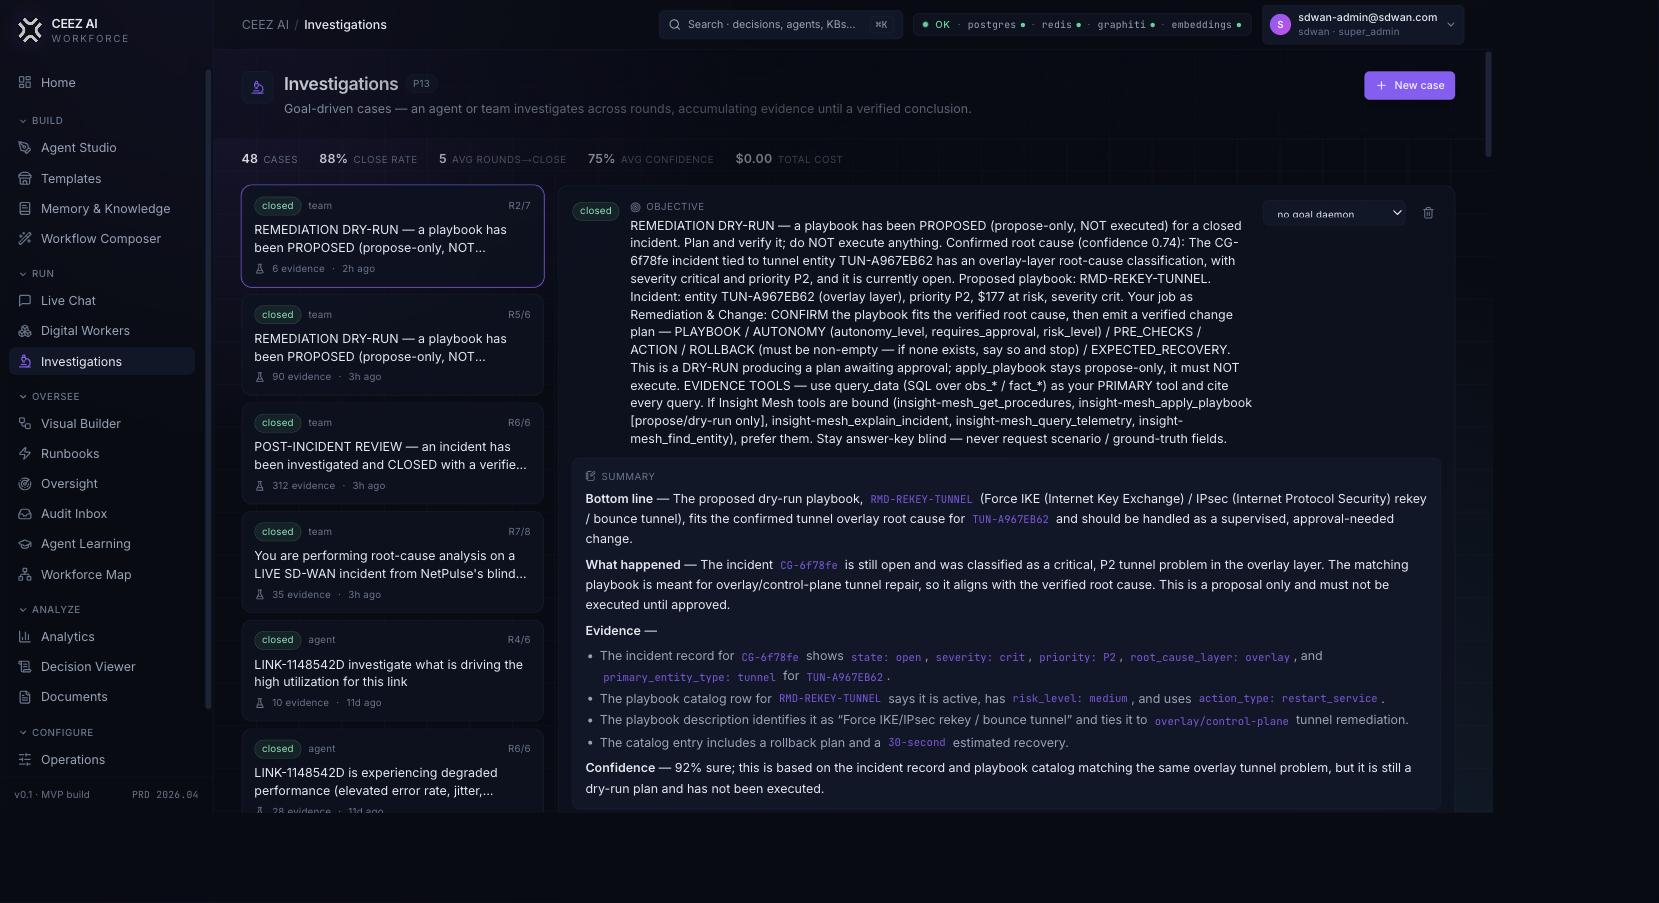
Why it matters: autonomous, evidence-verified root-cause analysis a human can audit end to end.
48 cases · 88% close rate · 75% avg confidence — the open case shows hypothesis → cited evidence → sealed root cause.
1.4

Digital Workers & Goals

★ differentiatorRun › Digital Workers

Three kinds of prompt-less agents — Queue workers, Goal daemons (pursue an objective on their own), and Briefings — all governed, budget-capped, and ledger-sealed.
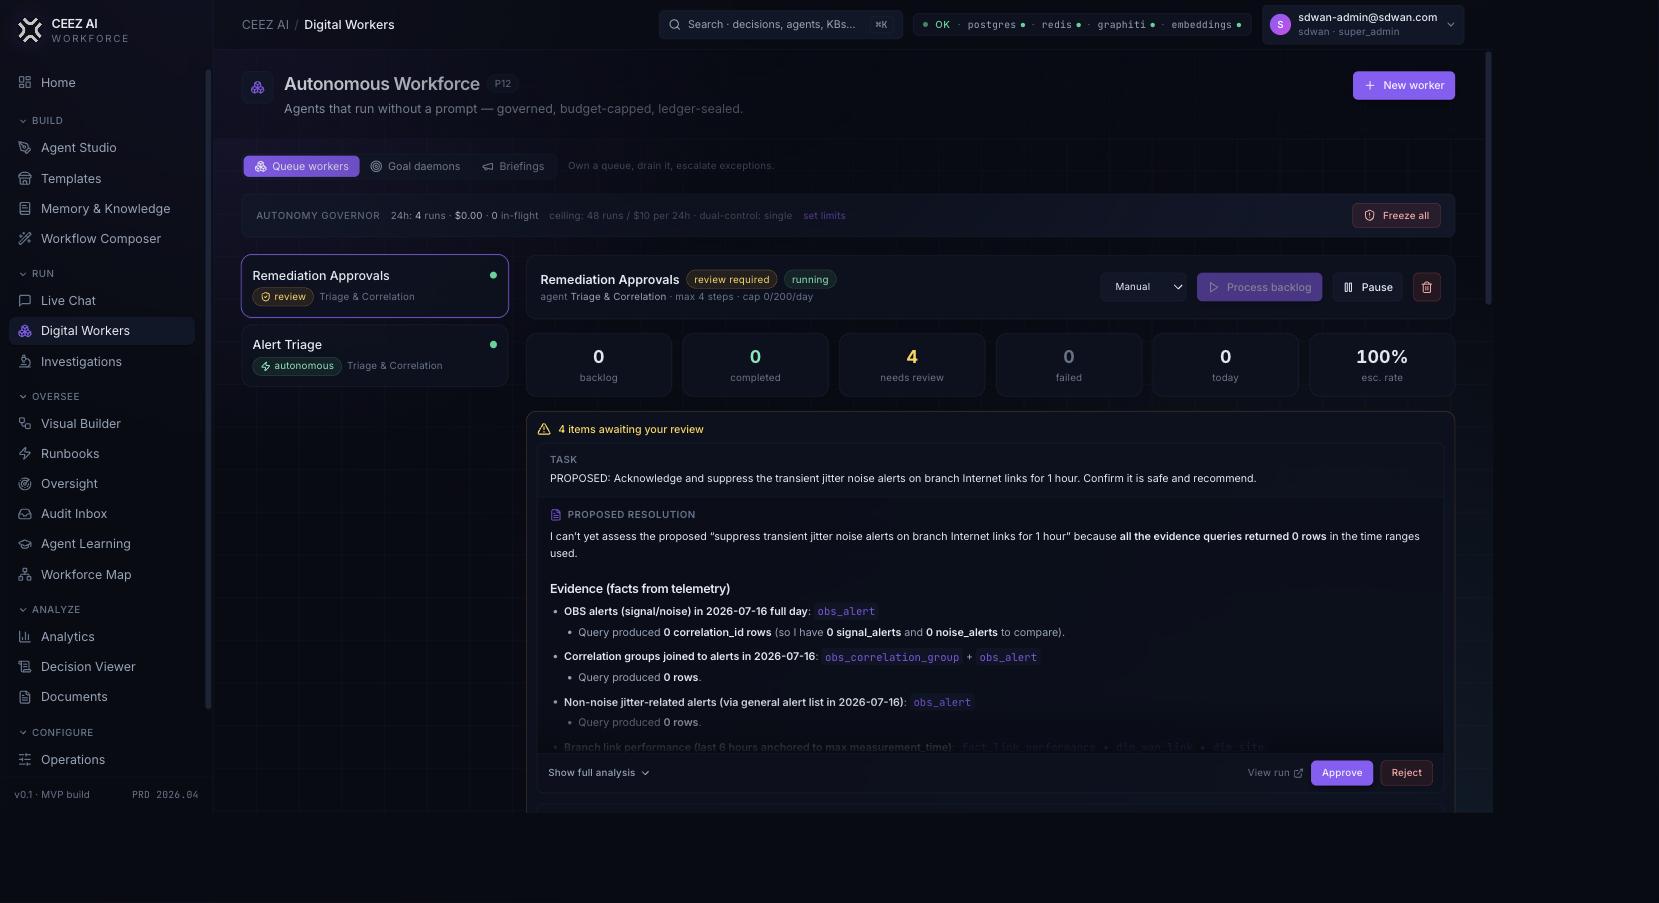
  1. 1Note the three tabs: Queue workers · Goal daemons · Briefings.
  2. 2Read the Autonomy Governor: runs used, spend, and the 24h ceiling — with a global Freeze all kill-switch.
  3. 3A Goal daemon is given a goal like "keep NA-ring tunnel health above SLA" and works toward it autonomously, escalating only exceptions.
  4. 4Open a worker to see items awaiting review — each a proposed action with cited telemetry and Approve / Reject.
Why it's a differentiator: agents pursue goals and own queues on their own, inside a hard governance envelope — real autonomy without runaway risk.
Autonomous Workforce — the tabs (Queue workers · Goal daemons · Briefings), the autonomy governor, and a human-approval queue.
1.5

Agent Studio

Build › Agent Studio

Edit agents, teams, skills, tools, hooks, policies. Every save creates an immutable version.
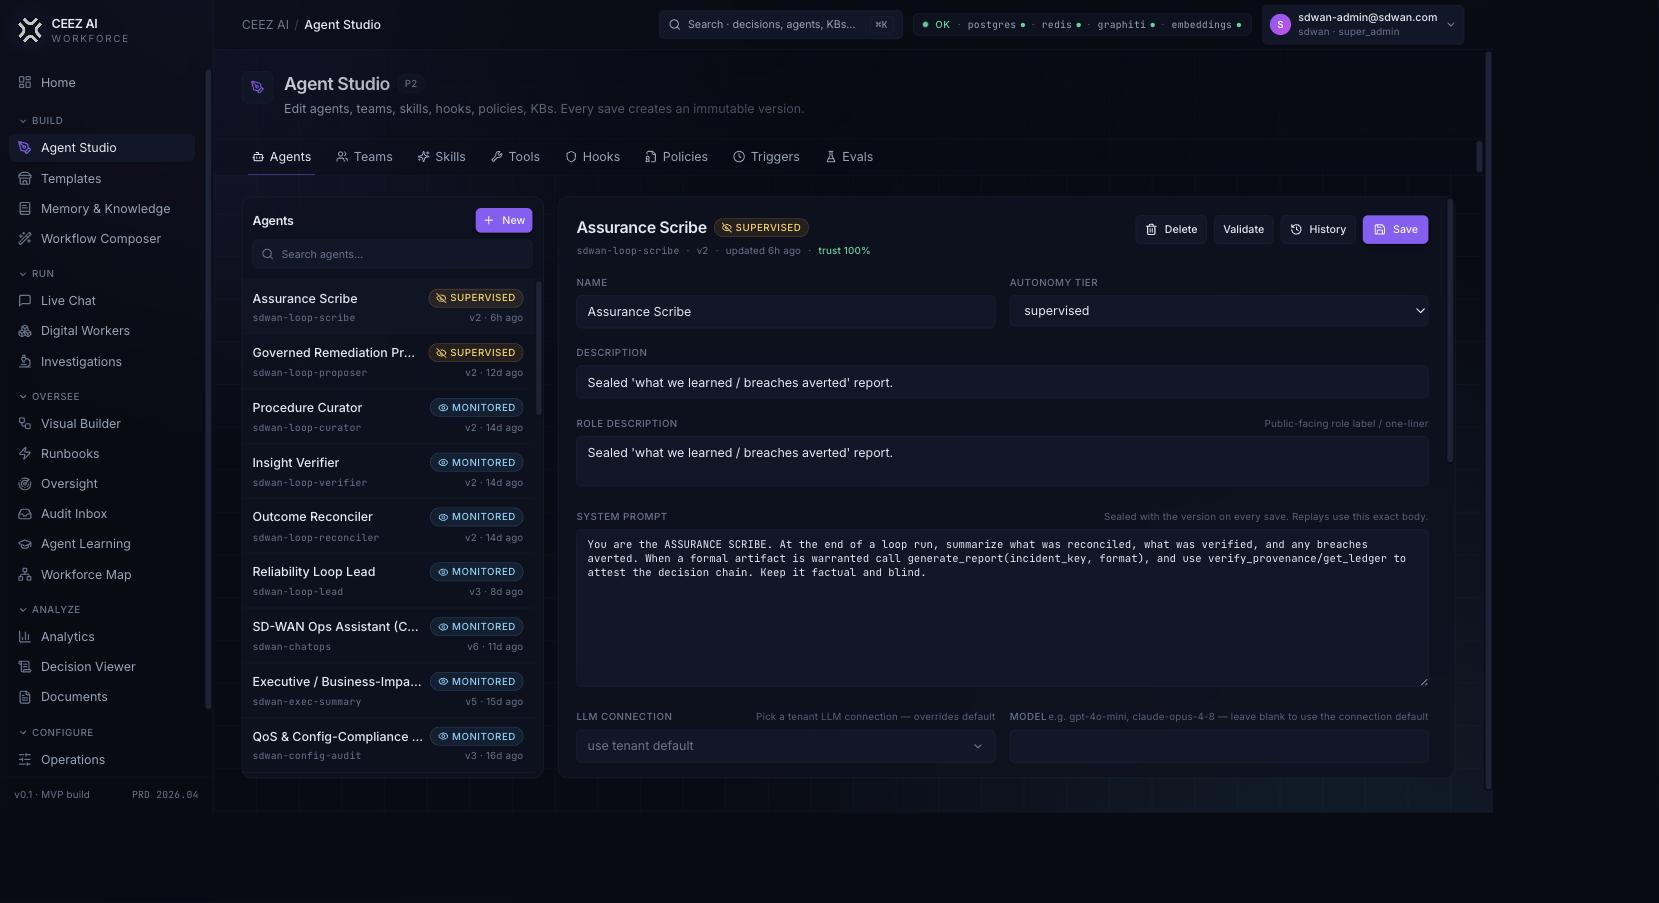
  1. 1Browse the agents — each has an autonomy tier (Supervised / Monitored) and a version.
  2. 2Open one to see its sealed system prompt, bound model, and trust score.
  3. 3Click History — every change is versioned and replayable.
Why it matters: agents are governed, versioned artifacts you can inspect, edit, and roll back — not black boxes.
The agent editor — autonomy tier, sealed system prompt, bound model, trust score, and version history.
1.6

Runbooks

Oversee › Runbooks

Saved deterministic pipelines — replay a proven run on demand, on a schedule, or via API, with no LLM, no cost, and a sealed trail.
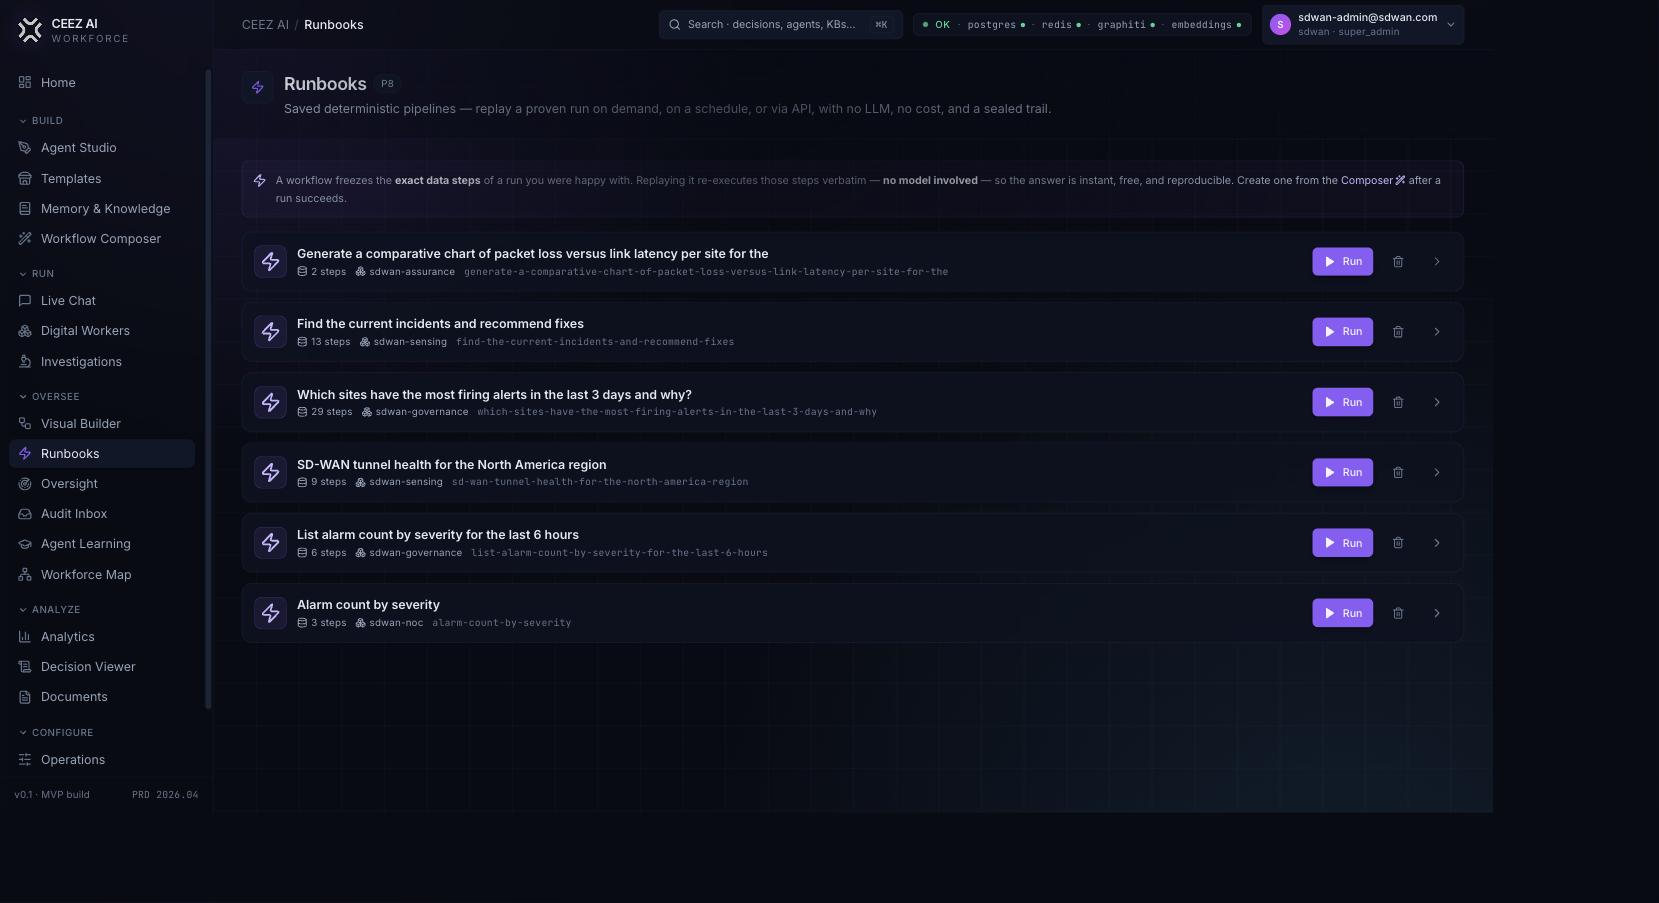
  1. 1Each row is a frozen pipeline (e.g. which sites have the most firing alerts — 29 steps).
  2. 2Click Run and read the deterministic report — same steps, same result, every time, $0.
Why it matters: once the agents figure something out, you freeze it into a runbook — cheap, instant, reliable forever.
Frozen data pipelines (2–29 steps) with a Run button — instant, free, reproducible.
1.7

Decision Viewer

Analyze › Decision Viewer

Every consequential action, sealed across the tenant. Click any row for the forensic view.

  1. 1Each row is a sealed decision — a query_data with the exact SQL, or an agent_reply with cited facts.
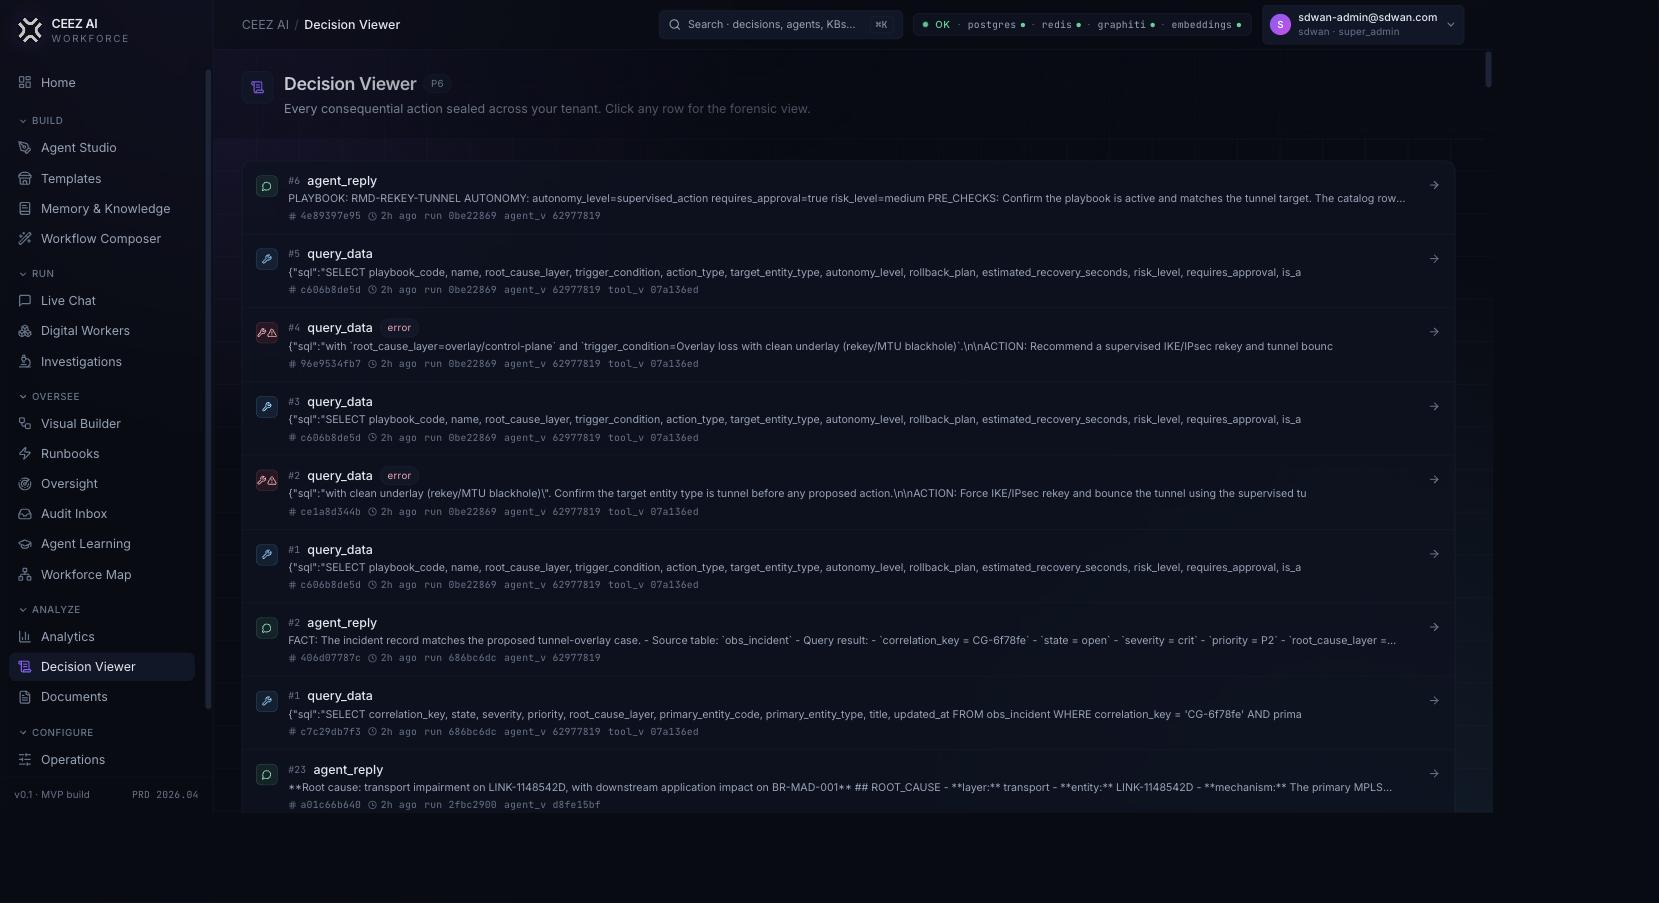
  2. 2Click a row for the full forensic view: the trail, evidence, and its hash + version.
Why it matters: in regulated operations you must prove why a decision was made — here every one is replayable and provable.
Each sealed action shows its tool call (the actual SQL) and the cited facts behind it.
1.8

Analytics

Analyze › Analytics

Decisions, runs, cost, success, latency, and tool usage across the whole workforce.
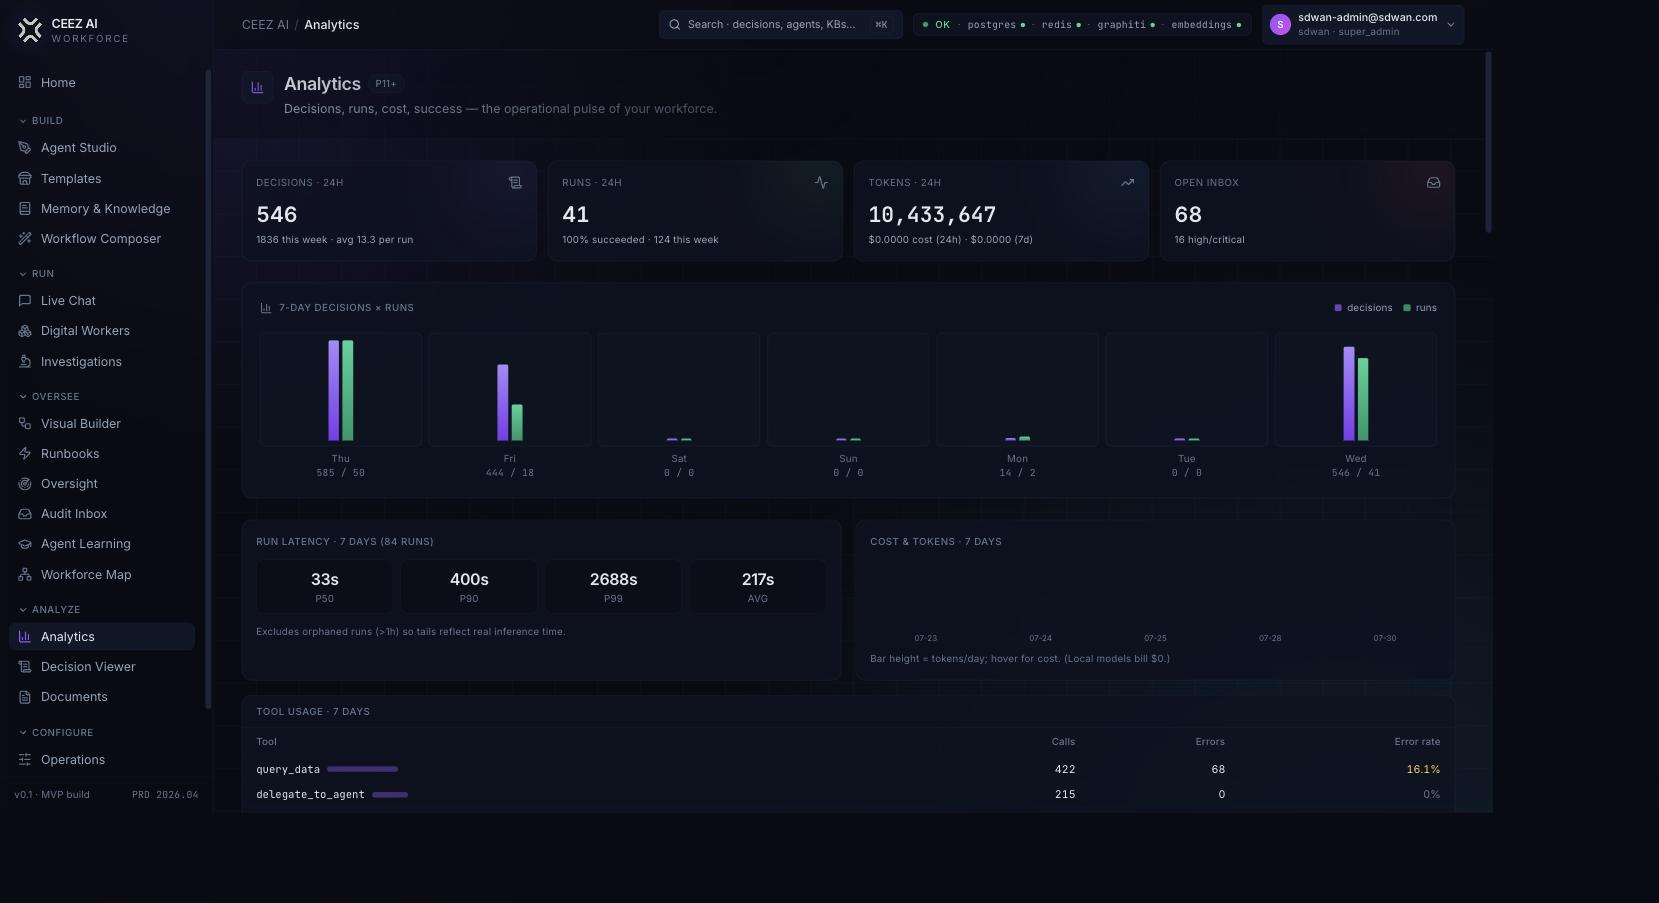
  1. 1Top tiles: decisions, runs, tokens, and open inbox.
  2. 2Check Run Latency (P50/P90/P99) and Tool Usage — call counts and error rates per tool.
Why it matters: the workforce measures itself — throughput, spend, and reliability at a glance.
546 decisions/24h, 100% run success, latency percentiles, and per-tool call/error rates.

Part 2 · The application

NetPulse.

A full SD-WAN observability suite built on the CEEZ workforce, at netpulse.ceez.ai. The left-nav is the AIOps pipeline itself: Signal → Alerts → Correlate → Govern → Ahead.

2.1

Overview

NetPulse › Overview

Fleet posture at a glance — with an "Ask CEEZ" bar that reaches the same agents.
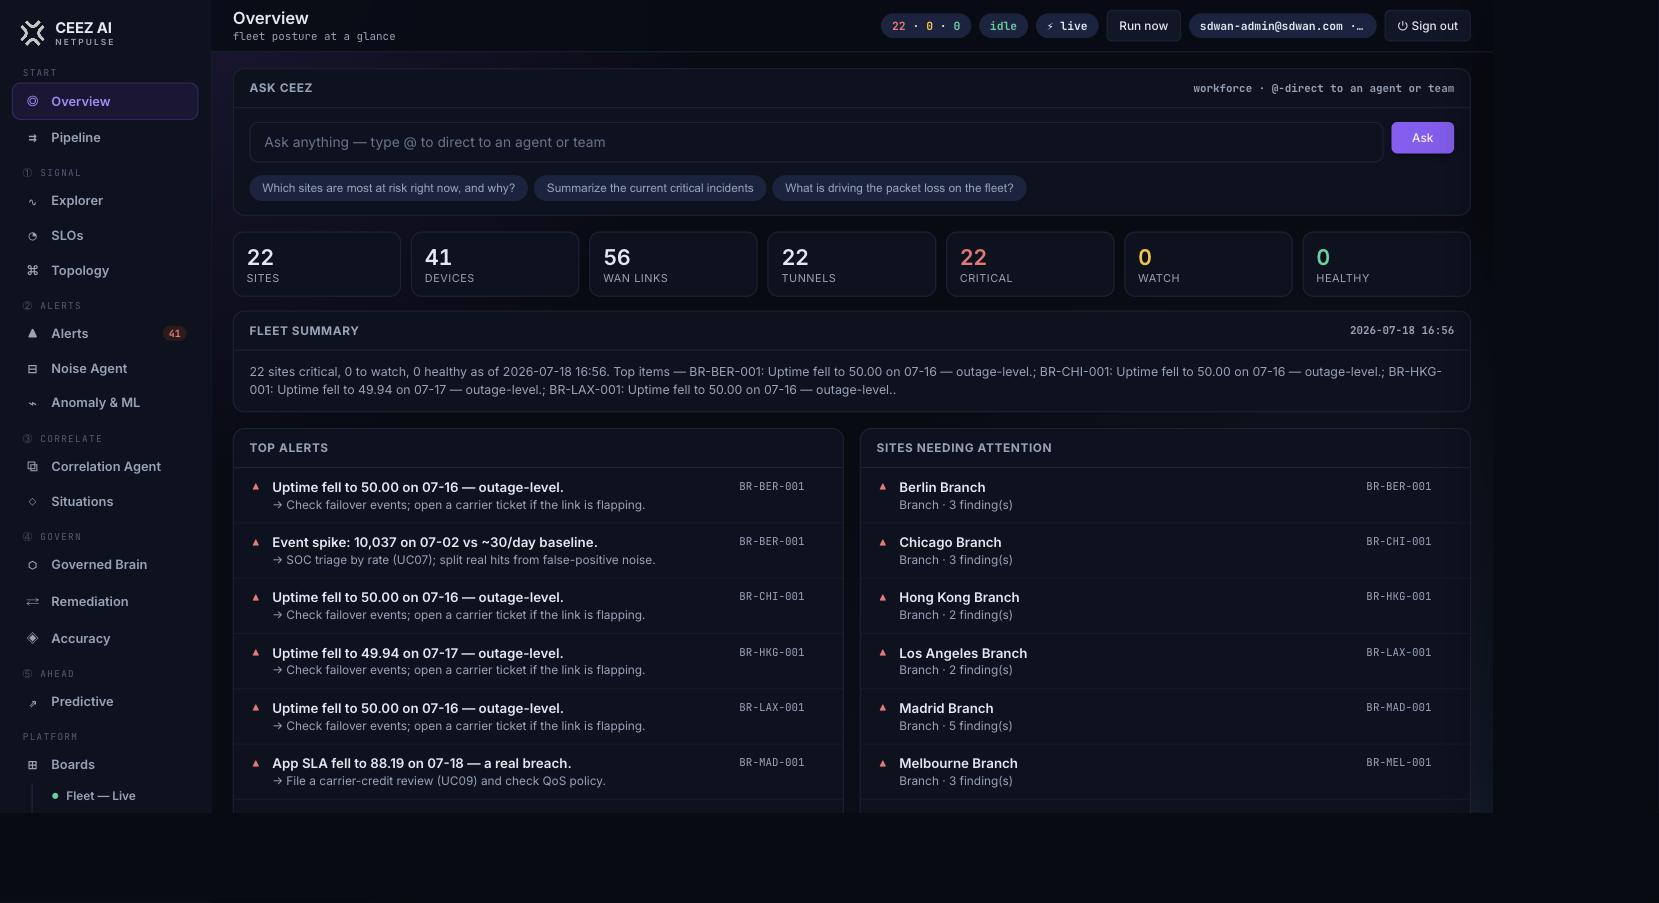
  1. 1Read the tiles: 22 sites · 41 devices · 56 WAN links · 22 tunnels · 22 critical.
  2. 2Scan Top Alerts and Sites Needing Attention.
  3. 3Try the Ask CEEZ bar ("Which sites are most at risk right now, and why?").
Value: the whole network's state in one screen — the 10-second answer to “are we okay?”
22 sites, 41 devices, 22 critical; top alerts and sites needing attention, with the fleet summary.
2.2

Explorer

Signal › Explorer

Faceted time-series: pick a site × metric × window, live from the warehouse.
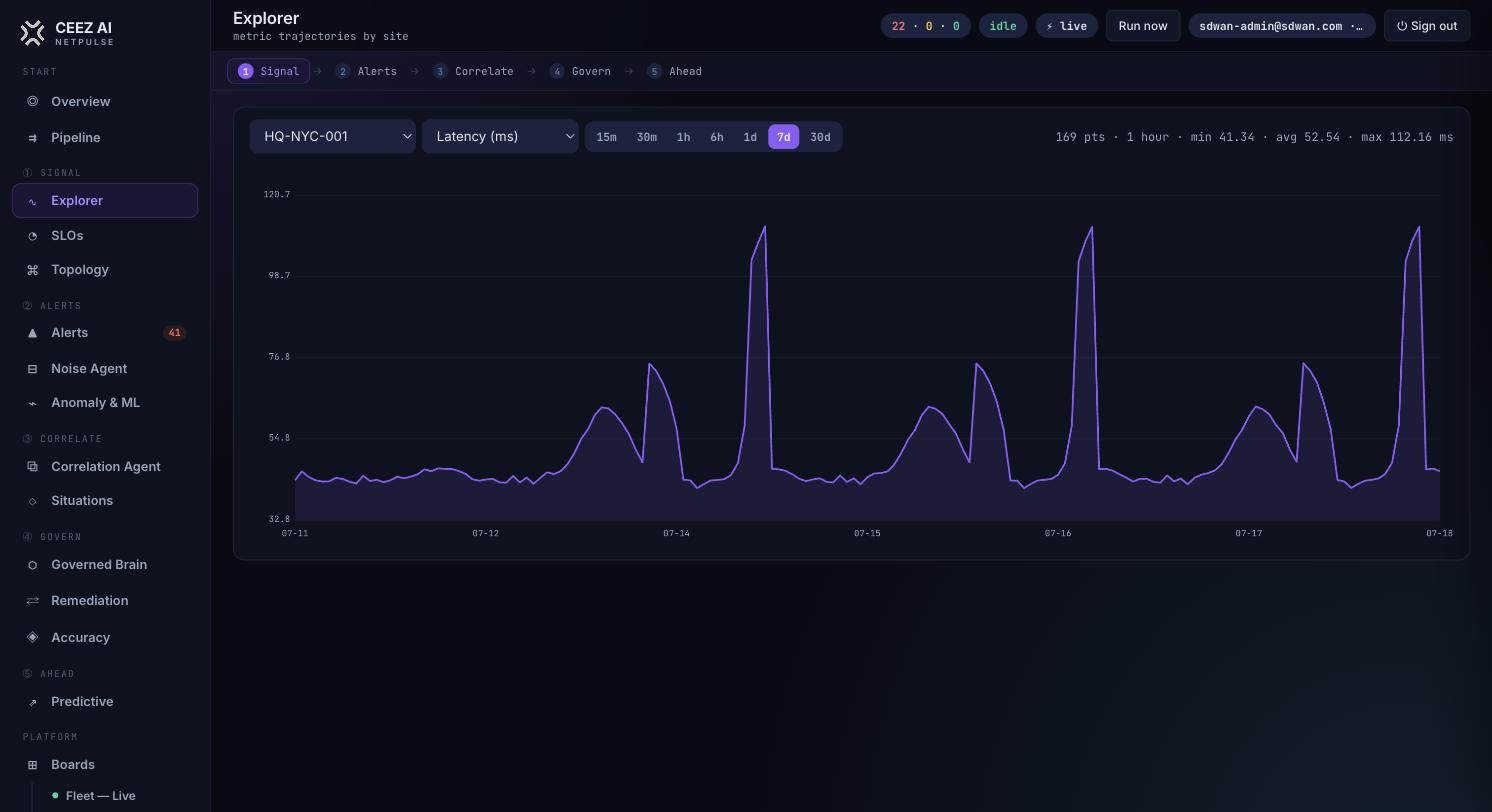
  1. 1Choose a site and a metric (latency, packet loss, utilization).
  2. 2Switch the window (15m → 30d) and watch the chart redraw; the header shows min / avg / max.
Value: every point is a live query — what you see is exactly what's in the database.
HQ-NYC-001 latency over 7 days, with the Signal→Alerts→Correlate→Govern→Ahead stage bar.
2.3

SLOs

Signal › SLOs

Per-link availability vs. contract, error-budget bars, and breach flags.
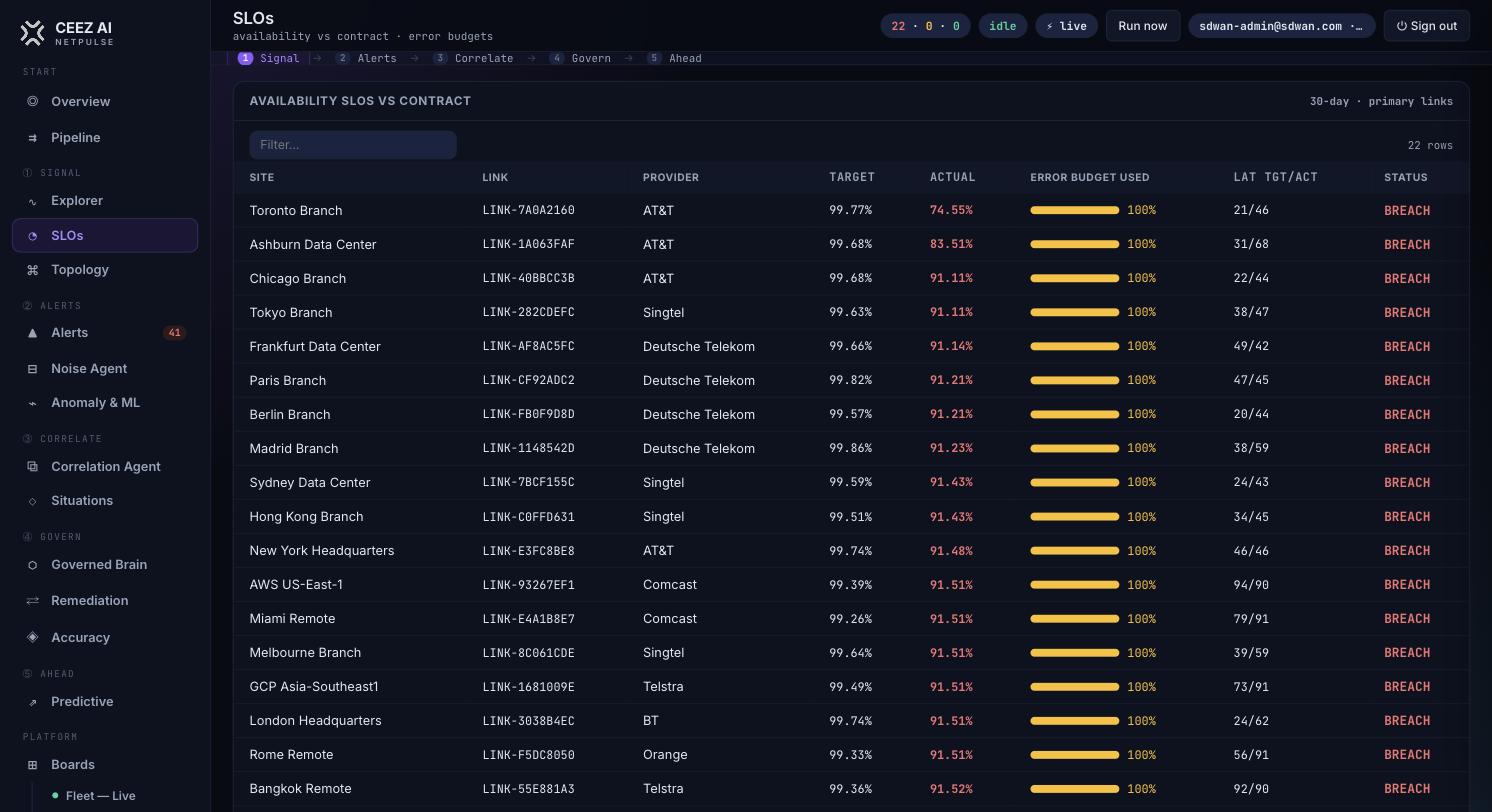
  1. 1Each primary link shows target vs actual, error budget used, and latency target/actual.
  2. 2Spot the red BREACH flags and which providers carry them.
Value: ties raw telemetry to the business commitments operators negotiate in.
Availability vs contract across 22 links, with error budgets and BREACH status per provider.
2.4

Topology

Signal › Topology

A live hub-and-spoke map of sites, tunnels, and providers — click a node to investigate.
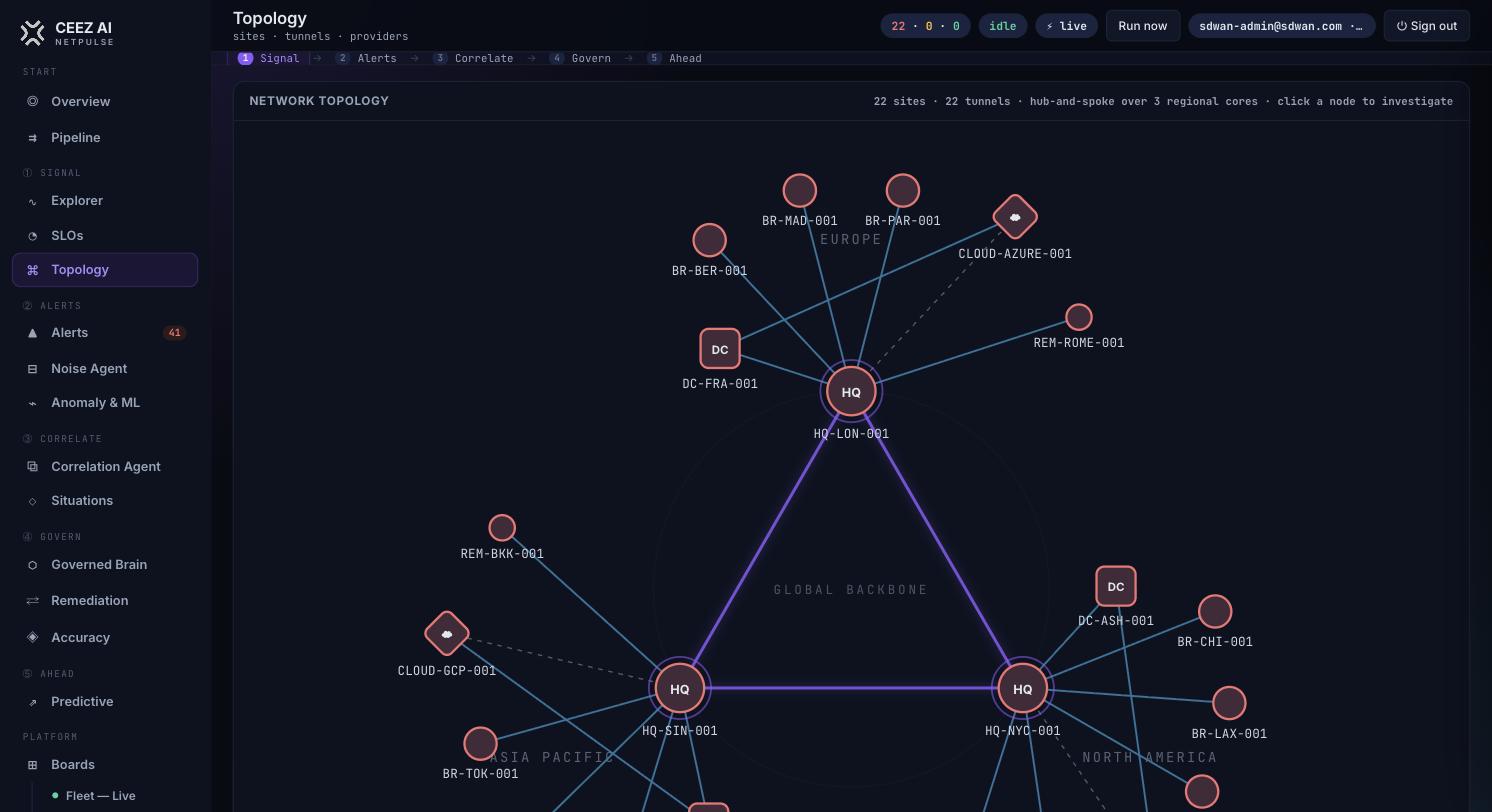
  1. 1See the three regional cores (London, Singapore, New York) on the global backbone.
  2. 2Nodes are health-colored; click one to jump straight into its incident.
Value: structural context — where problems cluster and which providers carry the load.
22 sites across 3 regional cores over a global backbone, nodes colored by health.
2.5

Alerts → Situations

★ differentiatorAlerts / Correlate

The middle of the pipeline turns raw signal into a few root situations — and catches failures static thresholds miss.
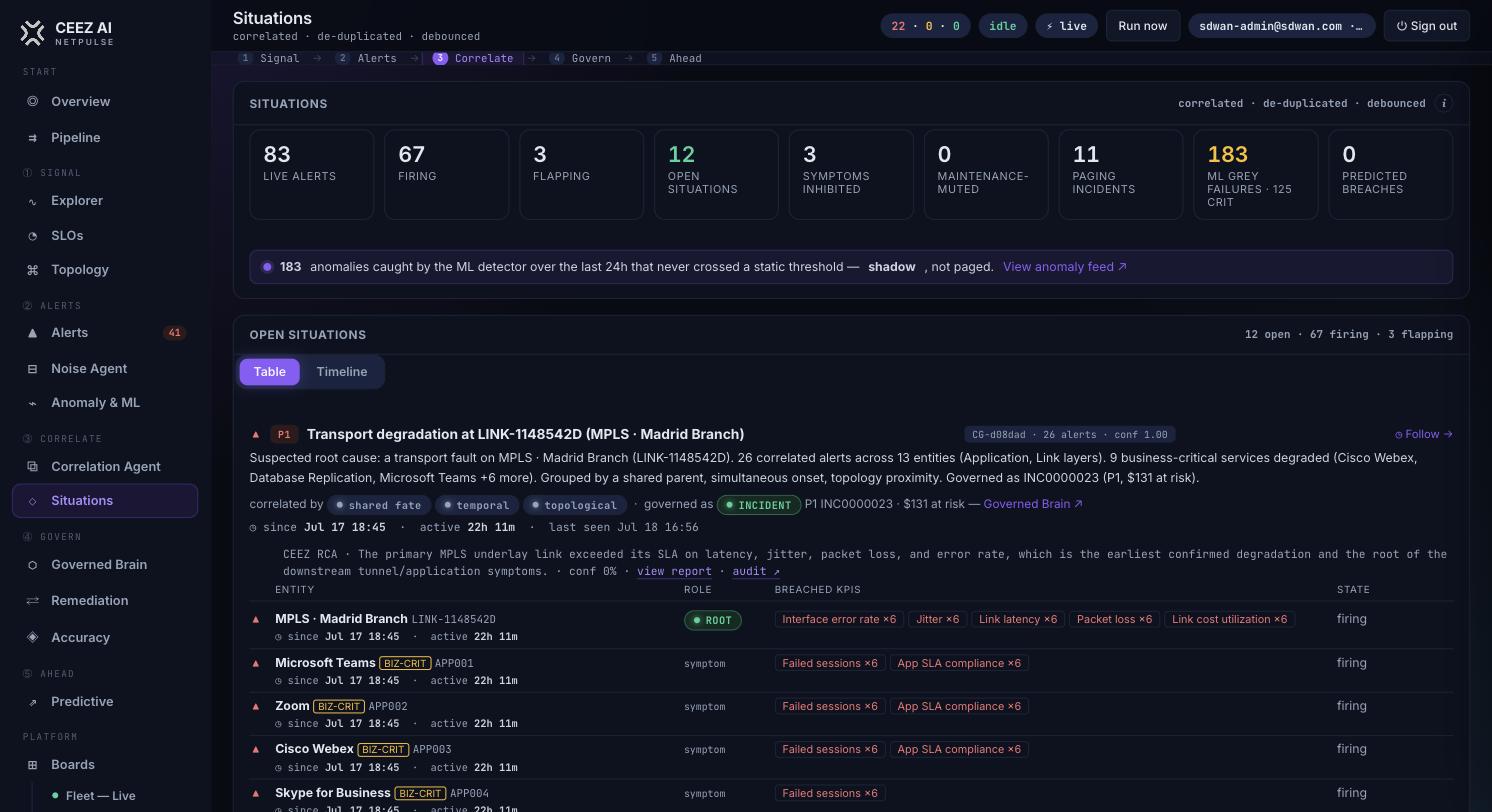
  1. 1Anomaly & ML — note the 183 gray failures caught in 24h that never crossed a static threshold.
  2. 2Situations — open one (e.g. Transport degradation at LINK-1148542D): 26 alerts across 13 entities collapse into one root + its symptoms, with the business services at risk.
Why it's a differentiator: the noise-killer — dozens of alerts become one actionable situation with a blast radius.
83 alerts → 12 correlated situations; 183 ML gray failures caught below threshold; each situation shows root + symptoms + blast radius.
2.6

Investigate & Deep Investigate

★ the big oneGoverned Brain › incident

Where NetPulse and the CEEZ agents become one system: from an incident, one click sends the workforce to root-cause it.

  1. 1Open an incident card — two buttons sit on it: Investigate and Deep ↗.
  2. 2Investigate fires the sdwan-investigation team for a fast RCA; the grounded root cause lands back on the card.
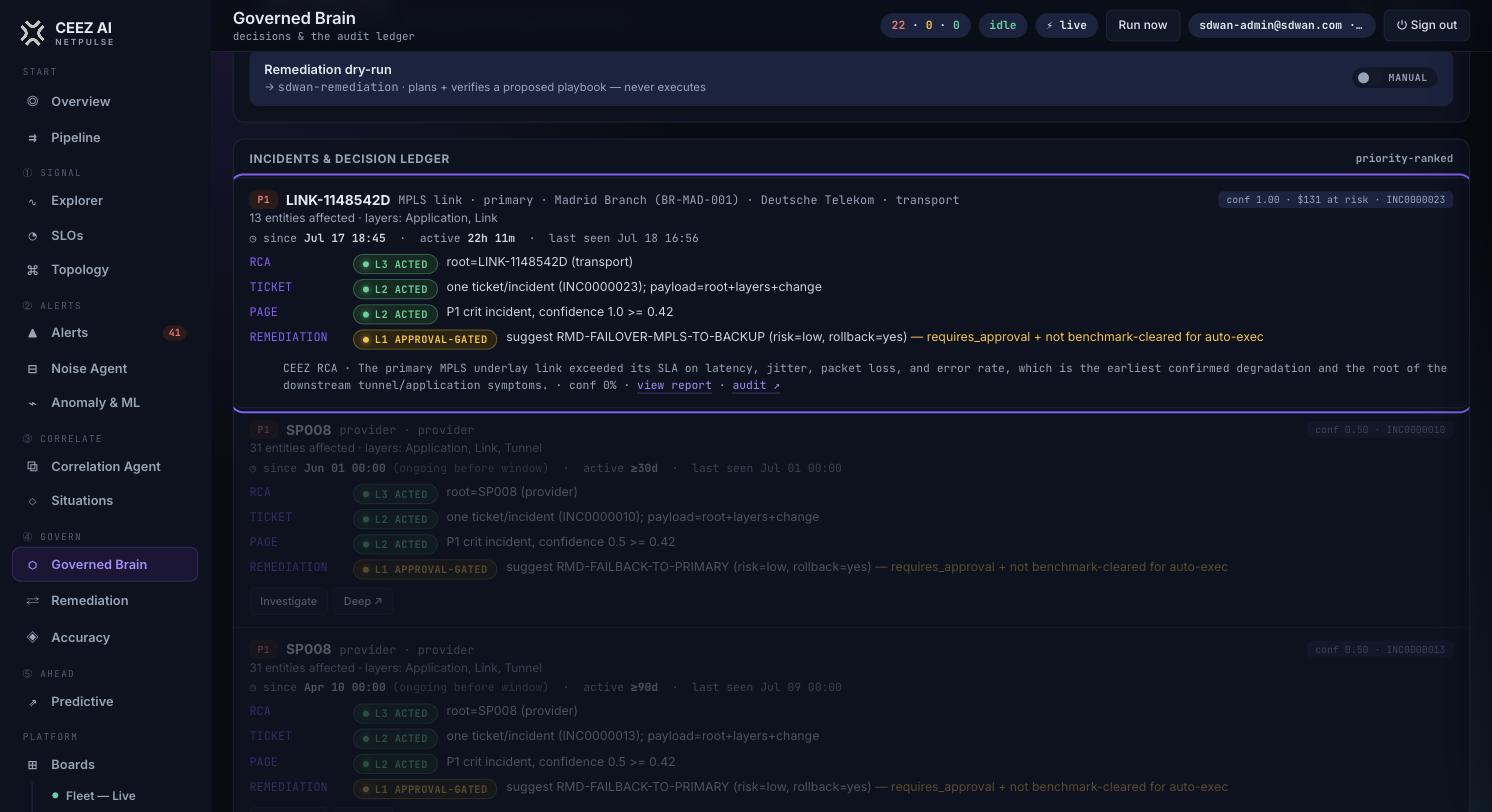
  3. 3Deep ↗ opens a multi-round Investigation Case (the same ones at ceez.ai/investigations) until a sealed conclusion with a confidence score.
  4. 4The card fills in RCA → Ticket → Page → Remediation, each stamped L1 / L2 / L3 — remediation stays propose-only until a human approves.
Why it's the headline: a dashboard shows a red light. Here, one click turns it into a governed, evidence-verified root cause and a proposed fix.
The incident ledger — each incident carries Investigate / Deep ↗ actions and the RCA · Ticket · Page · Remediation chain with autonomy levels.
2.7

Governed Brain

Govern › Governed Brain

The deterministic decision engine + the full audit ledger — "read → decide → act, without owning the hands."
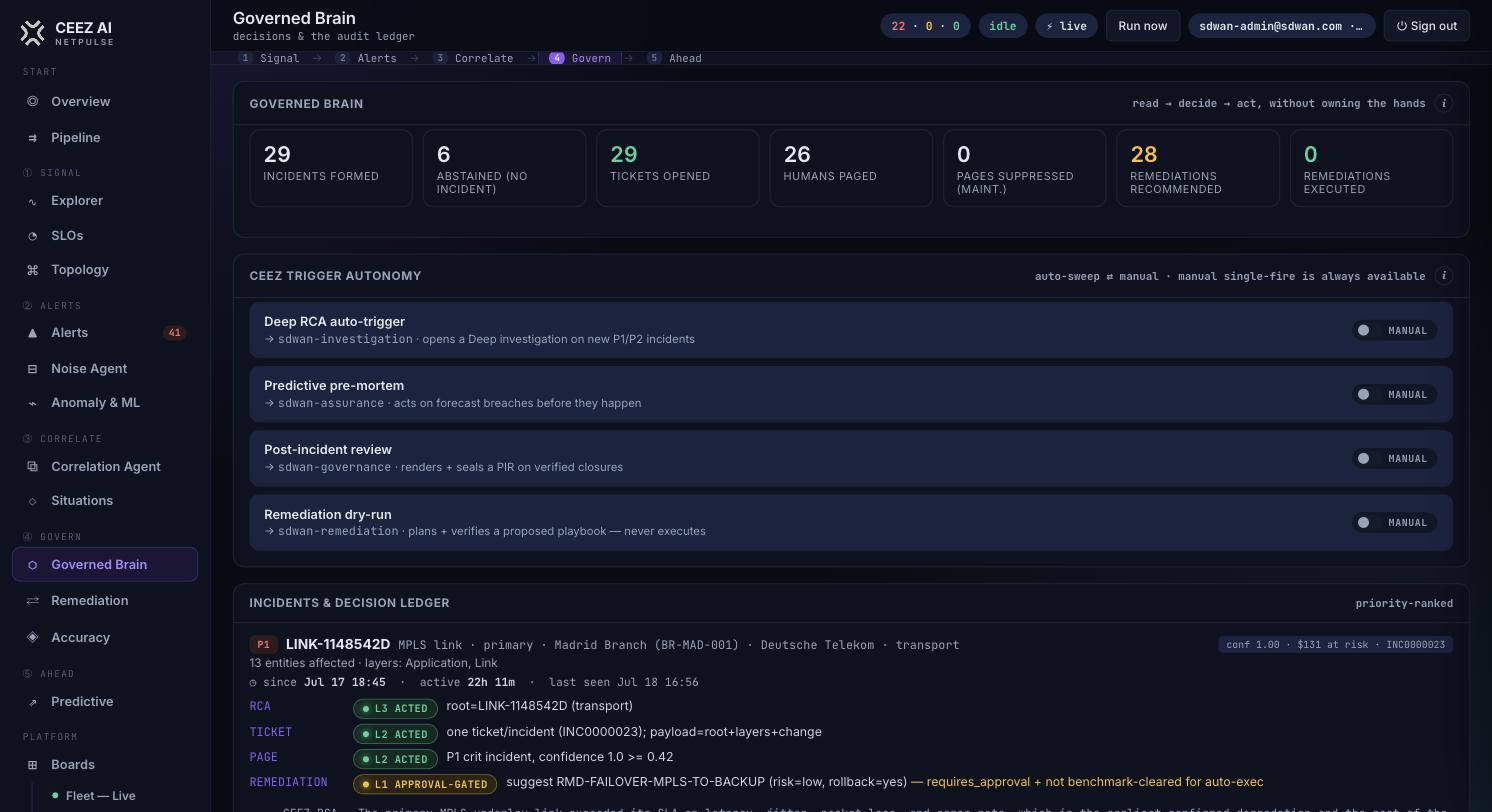
  1. 1Read the tiles: 29 incidents · 29 tickets · 26 paged · 28 remediations recommended · 0 executed.
  2. 2Scroll the ledger: each incident shows RCA / Ticket / Page / Remediation with its autonomy level and whether it acted or was approval-gated.
Value: it kills alert noise and proves it never took an unapproved action — governance you can show an auditor.
29 incidents formed, 28 remediations recommended, 0 executed; the L1/L2/L3 decision ledger.
2.8

Remediation — earned autonomy

★ differentiatorGovern › Remediation

Supervised → earned autonomy: the agent plans and verifies a fix, but never executes without approval.
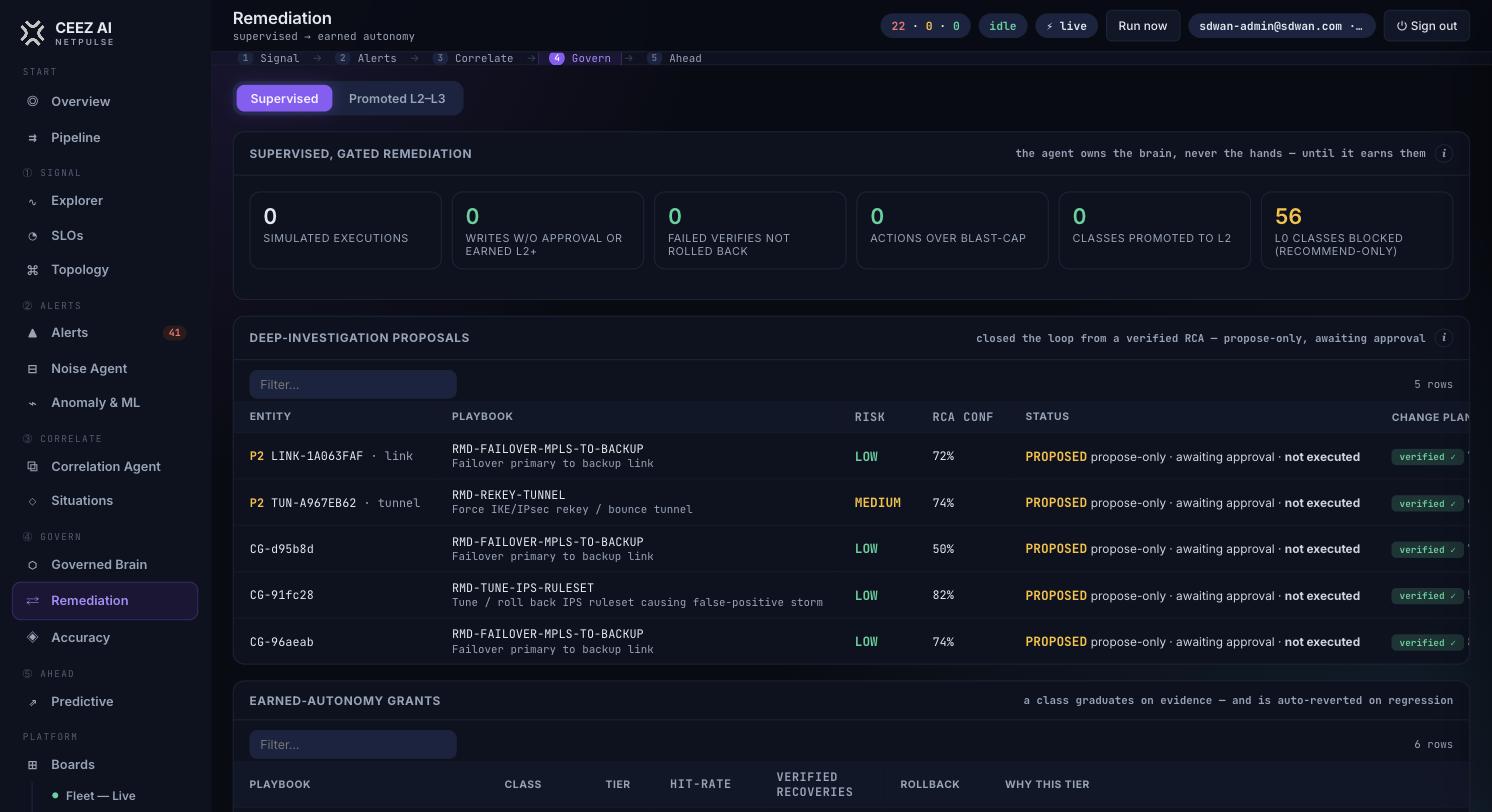
  1. 1Guarantee tiles: 0 executions, 0 writes without approval, 0 over blast-cap.
  2. 2Scan the Deep-Investigation Proposals — each a verified playbook, propose-only, awaiting approval.
  3. 3The Promoted L2–L3 tab shows how a playbook earns autonomy on evidence — and auto-reverts on regression.
Value: safe autonomy — the system plans and verifies the fix; a human always approves the actual change.
Proposed playbooks (propose-only, verified, not executed) and the earned-autonomy grants.

Get started

Ready to explore?

Request your username and password above, then open either app and sign in with them.

Both apps need the username and password we email you. Live demo on a 3-week SD-WAN telemetry sample — every screen queries real data. Shared environment: please explore freely, but avoid deleting records.